VPC Lattice: yet another connectivity option or a game-changer?
12 April 2024 - 4 min. read
Damiano Giorgi
DevOps Engineer


 In this second part of our journey (missed Part 1? Read it here!) covering the secrets and practices of Python’s logging, we’ll go a step further: managing multiple app instances (thus log streams), which is a pretty normal scenario in cloud projects, to aggregate logs using Kinesis Stream, ElasticSearch and Kibana Dashboard. Let’s go!
import boto3
import logging


class KinesisFirehoseDeliveryStreamHandler(logging.StreamHandler):

   def __init__(self):
       # By default, logging.StreamHandler uses sys.stderr if stream parameter is not specified
       logging.StreamHandler.__init__(self)

       self.__firehose = None
       self.__stream_buffer = []

       try:
           self.__firehose = boto3.client('firehose')
       except Exception:
           print('Firehose client initialization failed.')

       self.__delivery_stream_name = "logging-test"

   def emit(self, record):
       try:
           msg = self.format(record)

           if self.__firehose:
               self.__stream_buffer.append({
                   'Data': msg.encode(encoding="UTF-8", errors="strict")
               })
           else:
               stream = self.stream
               stream.write(msg)
               stream.write(self.terminator)

           self.flush()
       except Exception:
           self.handleError(record)

   def flush(self):
       self.acquire()

       try:
           if self.__firehose and self.__stream_buffer:
               self.__firehose.put_record_batch(
                   DeliveryStreamName=self.__delivery_stream_name,
                   Records=self.__stream_buffer
               )

               self.__stream_buffer.clear()
       except Exception as e:
           print("An error occurred during flush operation.")
           print(f"Exception: {e}")
           print(f"Stream buffer: {self.__stream_buffer}")
       finally:
           if self.stream and hasattr(self.stream, "flush"):
               self.stream.flush()

           self.release()
As you can see, and to be more specific, the provided example shows a class, the KinesisFirehoseDeliveryStreamHandler, that inherits the behavior of the native StreamHandler class. The StreamHandler‘s methods that were customized are emit and flush.The emit method is responsible for invoking the format method, adding log records to the stream, and invoking the flush method. How log data is formatted depends on the type of formatter configured for the handler. Regardless of how it is formatted, log data will be appended to the __stream_buffer array or, in case something went wrong during Firehose client’s initialization, to the default stream, i.e. sys.stderr.The flush method is responsible for streaming data directly into the Kinesis Data Firehose delivery stream through the put_record_batch API. Once records are streamed to the Cloud, local _stream_buffer will be cleared. The last step of the flush method consists of flushing the default stream.This is an illustrative yet robust implementation that you are free to copy and tailor to your specific needs.Once you have included the KinesisFirehoseDeliveryStreamHandler in your codebase, you’re ready to add it to the loggers’ configuration. Let’s see how the previous dictionary configuration changes to introduce the new handler.config = {
"version": 1,
"disable_existing_loggers": False,
"formatters": {
"standard": {
"format": "%(asctime)s %(name)s %(levelname)s %(message)s",
"datefmt": "%Y-%m-%dT%H:%M:%S%z",
},
"json": {
"format": "%(asctime)s %(name)s %(levelname)s %(message)s",
"datefmt": "%Y-%m-%dT%H:%M:%S%z",
"class": "pythonjsonlogger.jsonlogger.JsonFormatter"
}
},
"handlers": {
"standard": {
"class": "logging.StreamHandler",
"formatter": "json"
},
"kinesis": {
"class": "KinesisFirehoseDeliveryStreamHandler.KinesisFirehoseDeliveryStreamHandler",
"formatter": "json"
}
},
"loggers": {
"": {
"handlers": ["standard", "kinesis"],
"level": logging.INFO
}
}
}
To include the new custom handler to our configuration, it is enough to add a "kinesis" entry to the "handlers" dictionary and another one to the root logger’s "handlers" array.In the "handlers" dictionary’s "kinesis" entry we should specify the custom handler’s class and the formatter used by the handler to format log records.By adding this entry to the root logger’s "handlers" array, we are telling the root logger to write log records both in the console and in the Kinesis Data Firehose delivery stream.PS: the root logger is identified by "" in the "loggers" section.That’s all with the Kinesis Data Firehose log data producer configuration. Let’s focus on the infrastructure behind the put_record_batch API, the one used by the KinesisFirehoseDeliveryStreamHandler to stream log records to the Cloud.Beyond Kinesis Data Firehose’s put_record_batch APIThe architecture components needed to aggregate your application’s log records and make them available and searchable from a centralized dashboard are the following:a Kinesis Data Firehose delivery stream;an Amazon Elasticsearch Service cluster.To create a Kinesis Data Firehose delivery stream, we move to the AWS management console’s Kinesis dashboard. From the left side menu, we select Data Firehose. Once selected, we should see a list of delivery streams present in a specific region of your AWS account. To set up a brand new delivery stream, we’ll click on the Create delivery stream button in the top right corner of the page.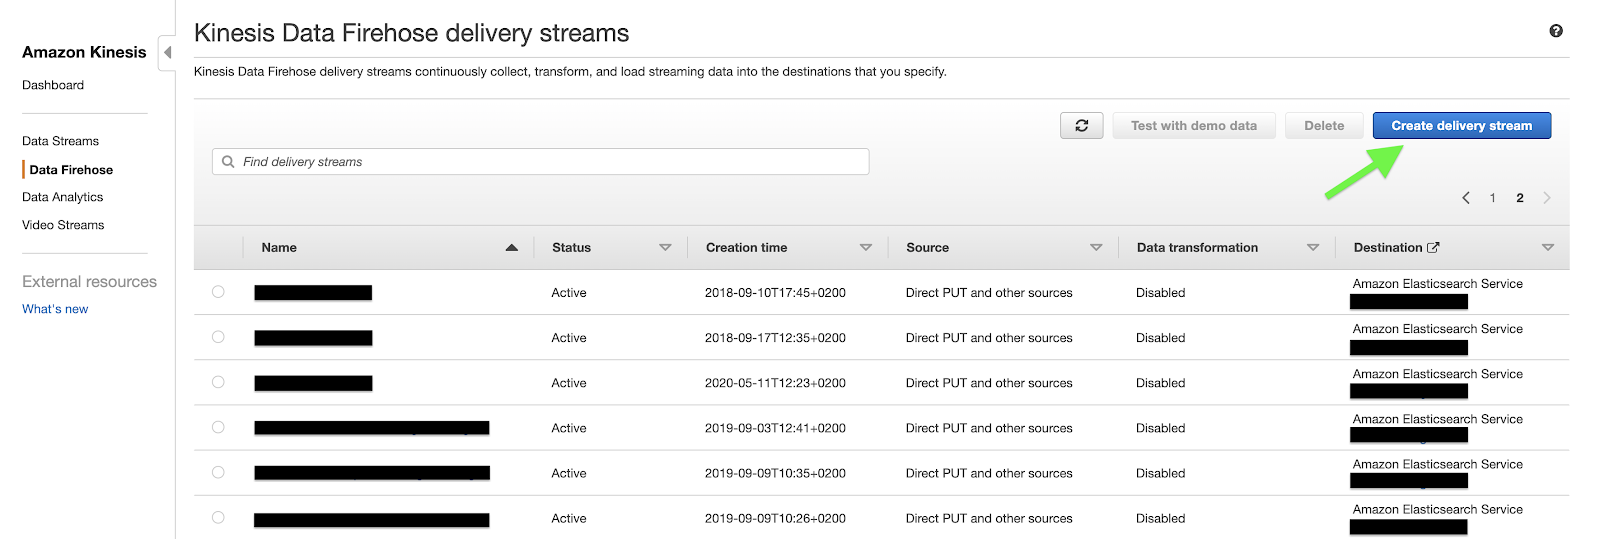 In the Create delivery stream wizard, we’ll be asked to configure the delivery stream’s source, transformation process, destination, and other settings like the permissions needed to Kinesis Data Firehose to load streaming data to the specified destinations.Since we’re loading data directly from our logger through boto3 SDK, we have to choose Direct PUT or other sources as delivery stream’s Source.
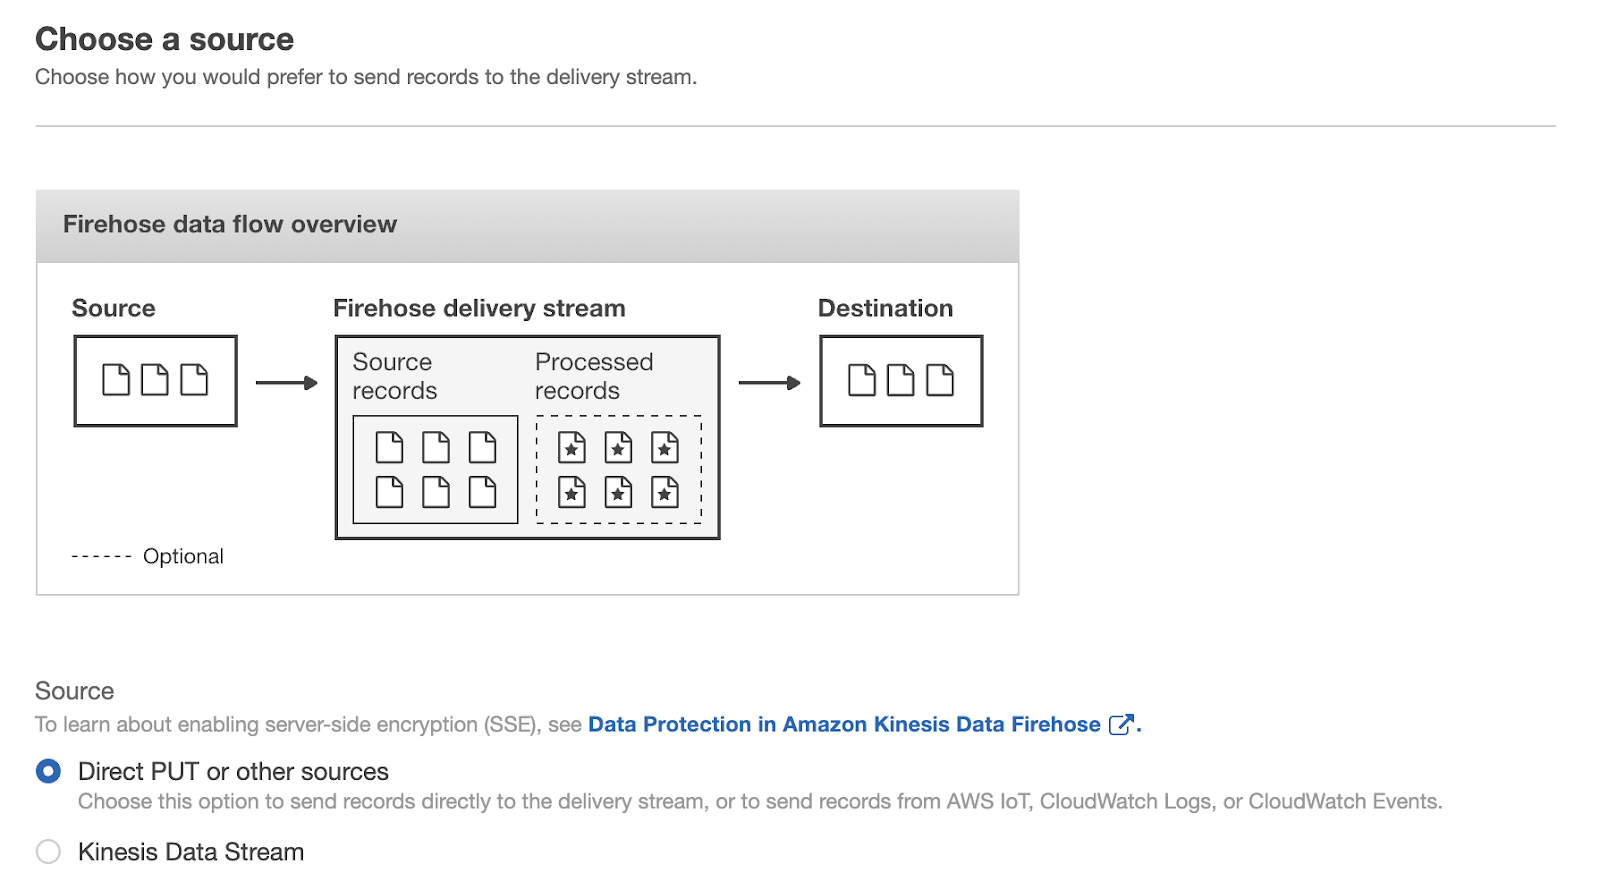 We’ll leave “transform” and “convert” options disabled since they’re not fundamental for the sake of this article.The third step of the wizard asks to specify the delivery stream’s destinations. Assuming that we’ve already created an Amazon Elasticsearch Service cluster in our AWS account, we set it as our primary destination, specifying the Elasticsearch Index name, rotation frequency, mapping type, and retry duration, i.e. how long a failed index request should be retried.
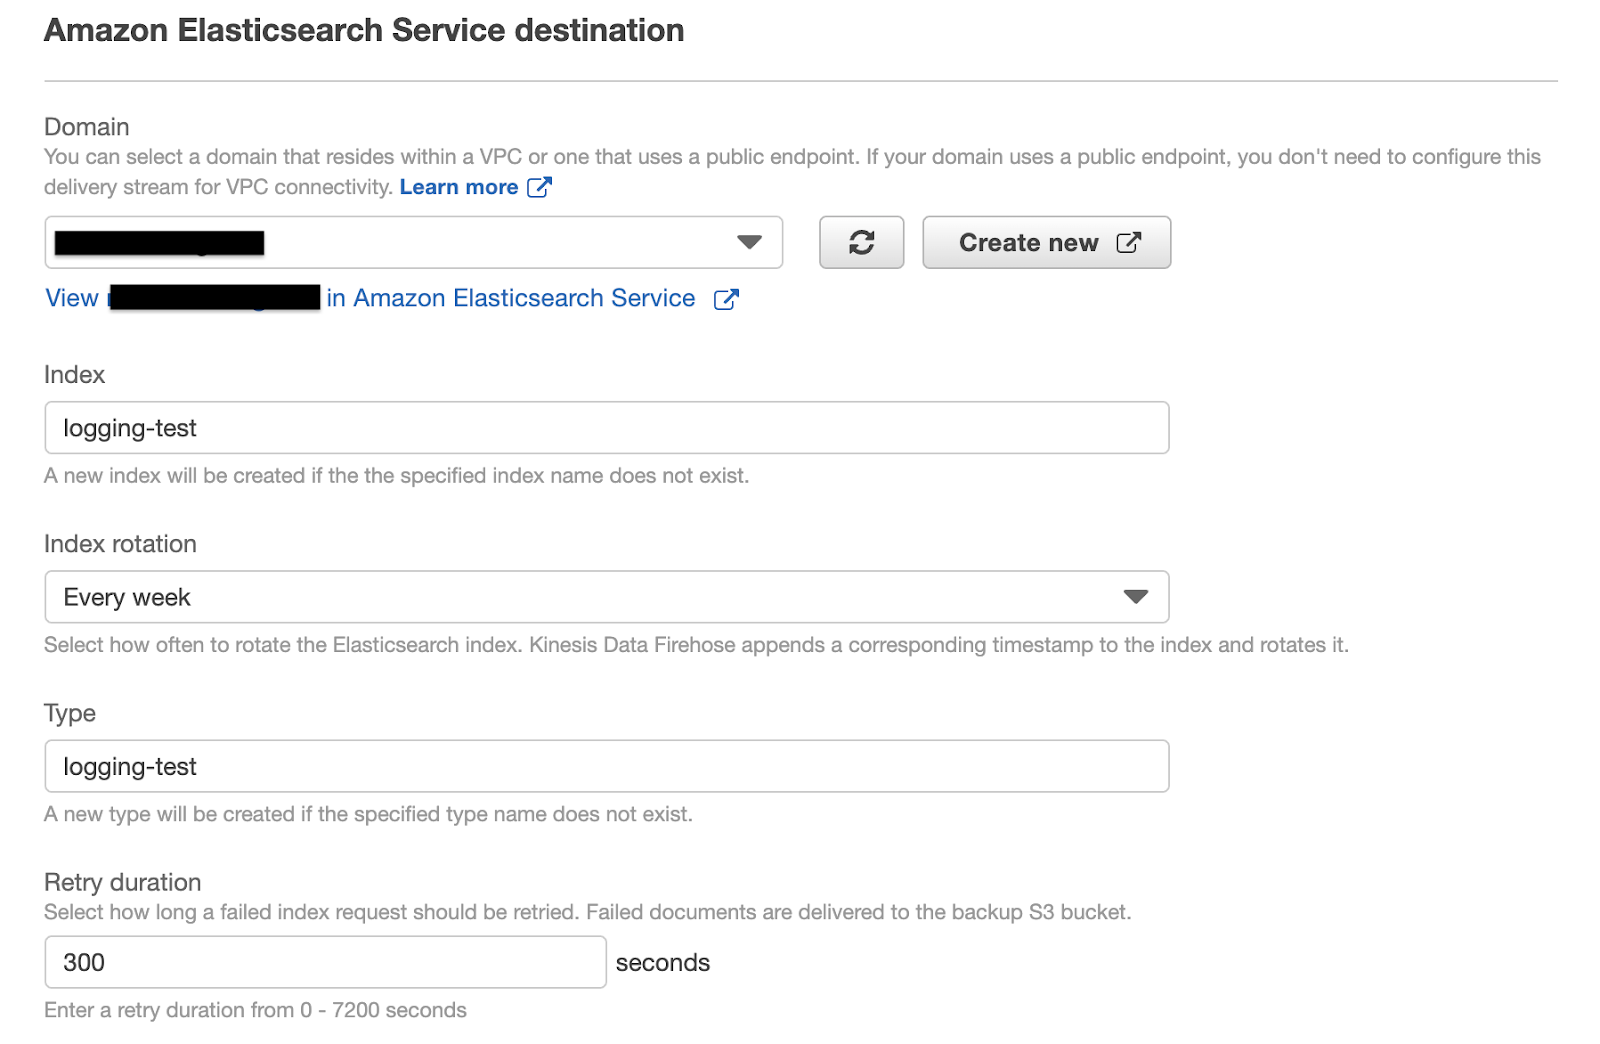 As a secondary destination of our delivery stream, we will set up an S3 bucket. As already mentioned before, this bucket will contain historical logs that are not subject to Elasticsearch index’s rotation logic.
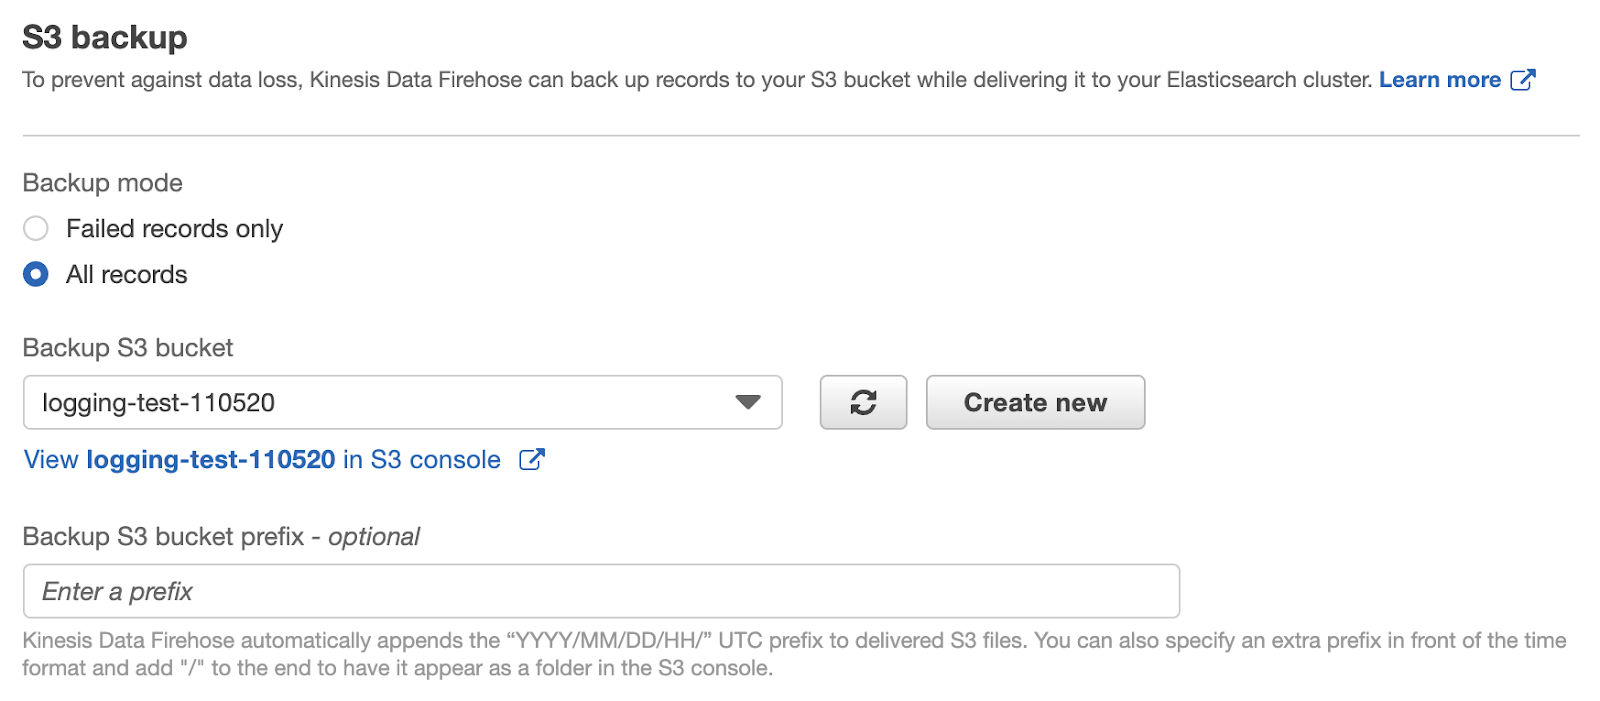 We will let S3 compression, S3 encryption, and error logging disabled and focus on the permissions. This last section requires us to specify or create a new IAM Role with a policy that allows Kinesis Data Firehose to stream data to the specified destinations. By clicking on Create new we’ll be guided in the creation of an IAM Role with the required permissions policy set.Log records streaming testOnce the delivery stream is created, we can finally test if code and architecture were correctly integrated. The following scheme illustrates the actors in play:
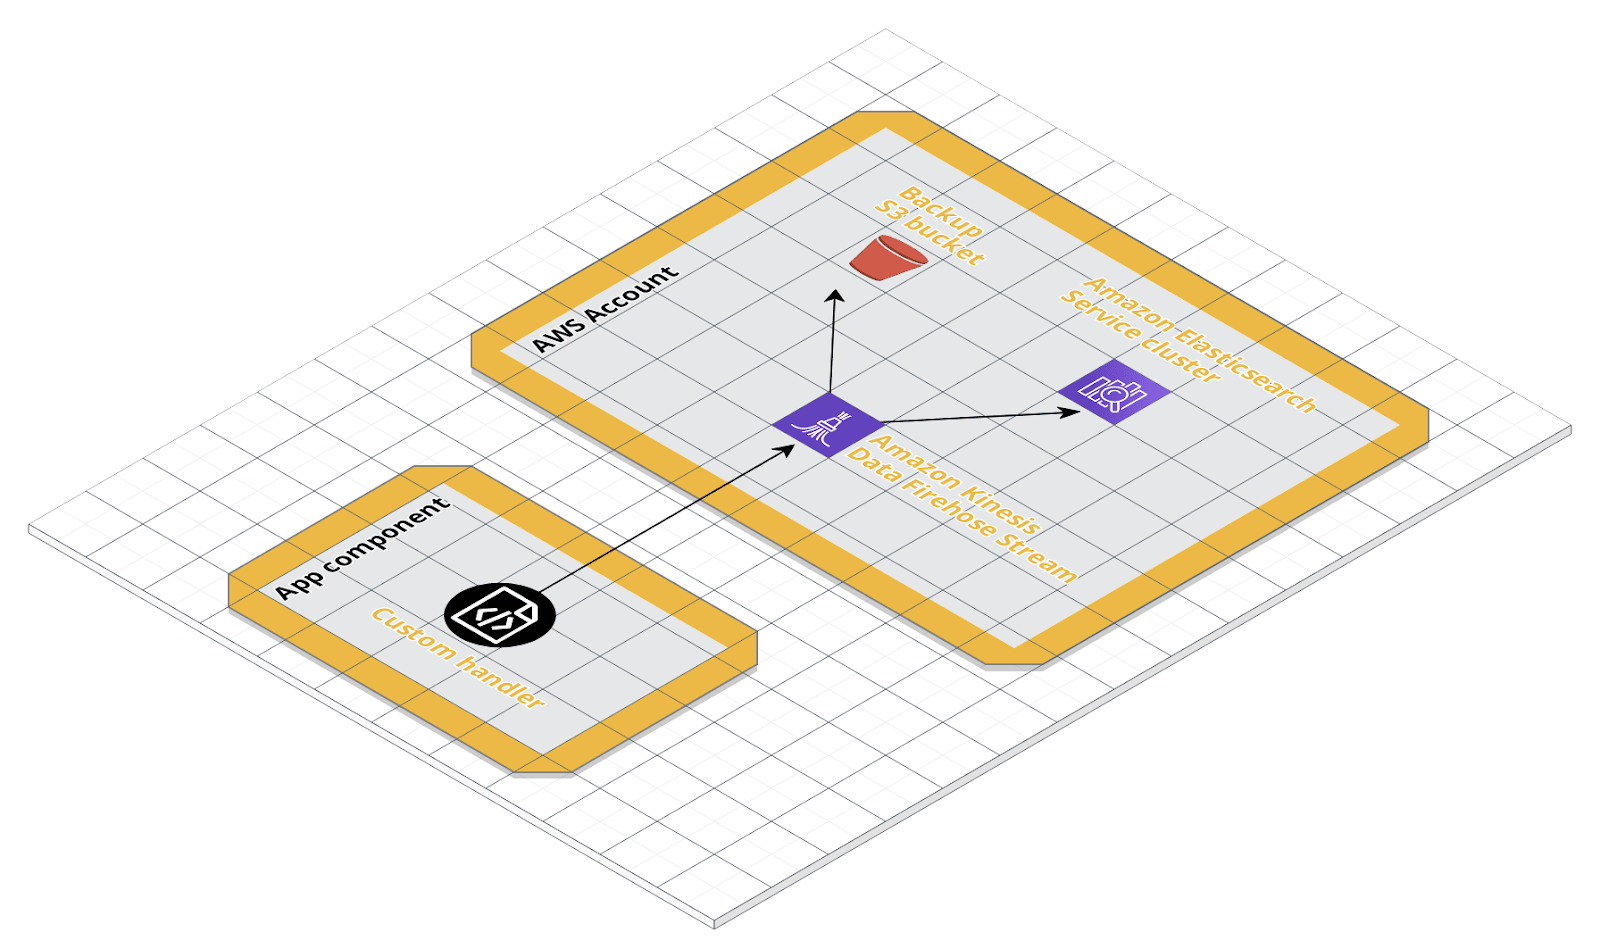 From our local machine, we’re going to simulate an App component that loads log data directly to a Kinesis Data Firehose delivery stream. For this test, we will use the config dictionary that already includes the KinesisFirehoseDeliveryStreamHandler.
import logging.config

config = {...}

logging.config.dictConfig(config)
logger = logging.getLogger(__name__)


def test():
   try:
       raise NameError("fake NameError")
   except NameError as e:
       logger.error(e, exc_info=True)
Running this test, a new log record will be generated and written either in the console and in the delivery stream.Here’s the console output of the test:{"asctime": "2020-05-11T14:44:44+0200", "name": "logging_test5", "levelname": "ERROR", "message": "fake NameError", "exc_info": "Traceback (most recent call last):\n File \"/Users/ericvilla/Projects/logging-test/src/logging_test5.py\", line 42, in test\n raise NameError(\"fake NameError\")\nNameError: fake NameError"}Well, nothing new. What we expect in addition to the console output is to find the log record in our Kibana console too.To enable search and analysis of log records from our Kibana console, we need to create an Index pattern, used by Kibana to retrieve data from specific Elasticsearch Indexes.The name we gave to the Elasticsearch index is logging-test. Therefore, indexes will be stored as logging-test-. Basically, to make Kibana retrieve log records from each Index that starts with logging-test-, we should define the Index pattern logging-test-*. If our KinesisFirehoseDeliveryStreamHandler worked as expected, the Index pattern should match a new Index.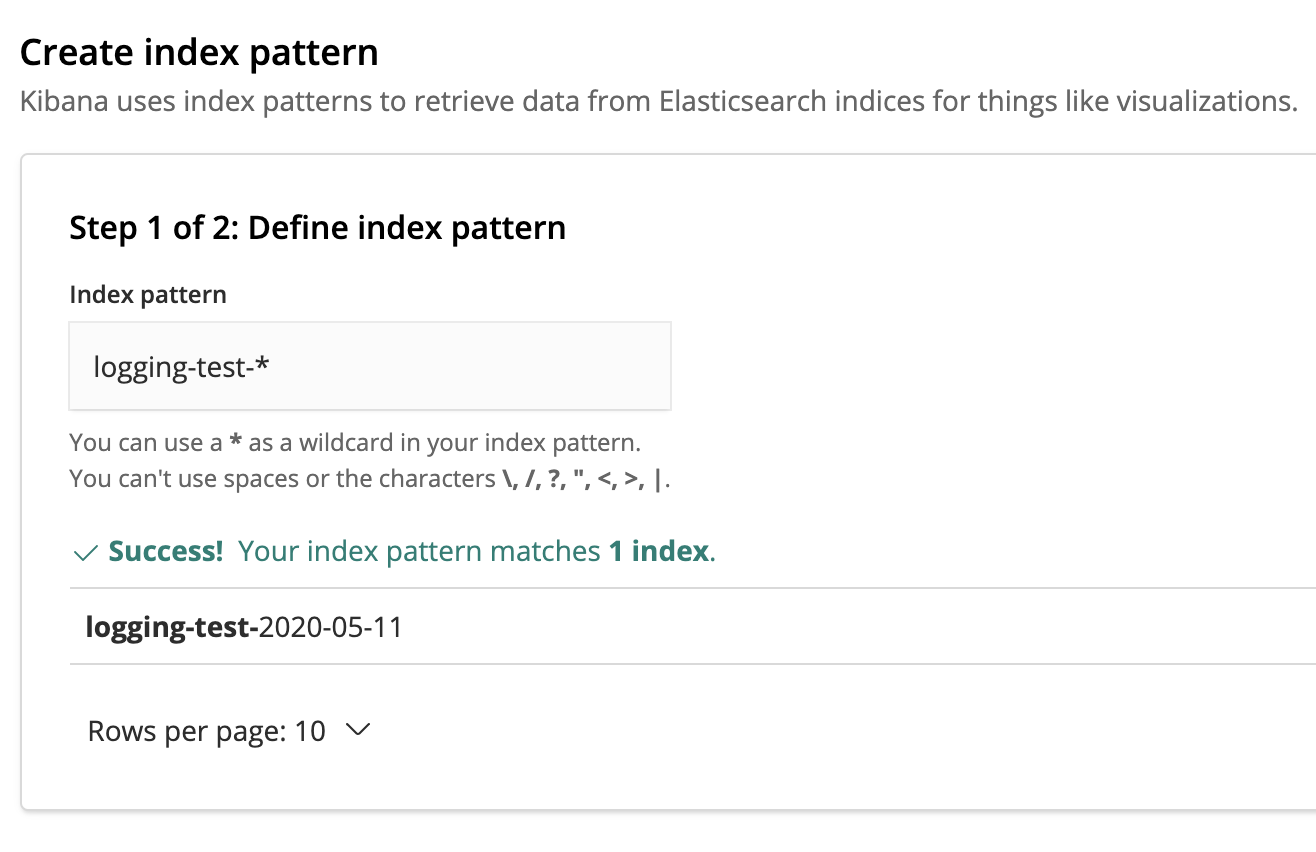 To filter log records by time, we can use the asctime field that our JSON formatter added to the log record.
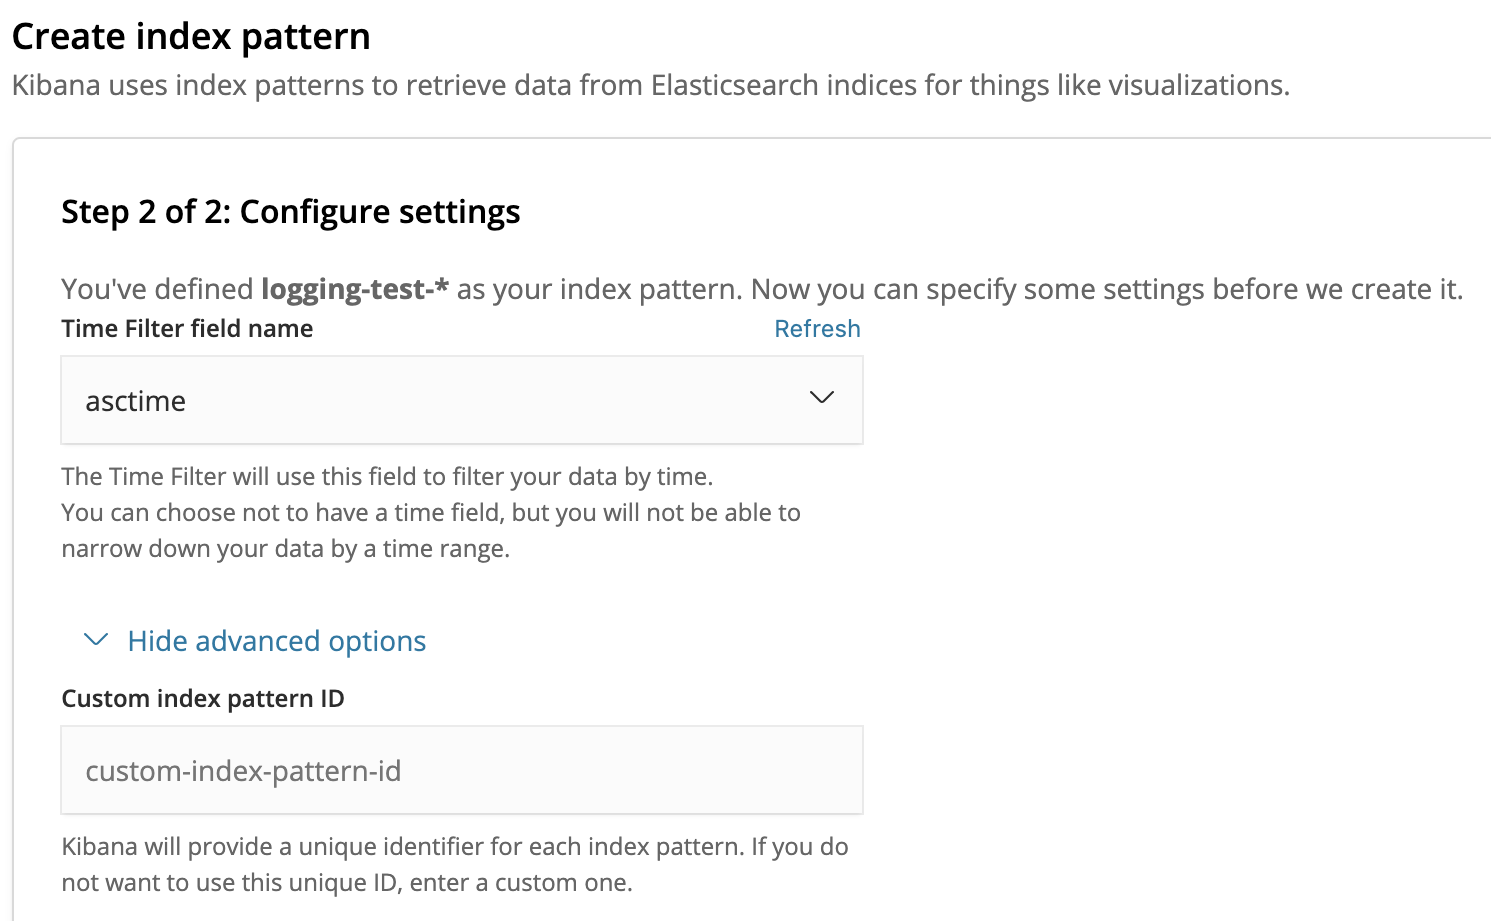 Once the Index pattern is created, we can finally search and analyze our application’s log records from the Kibana console!
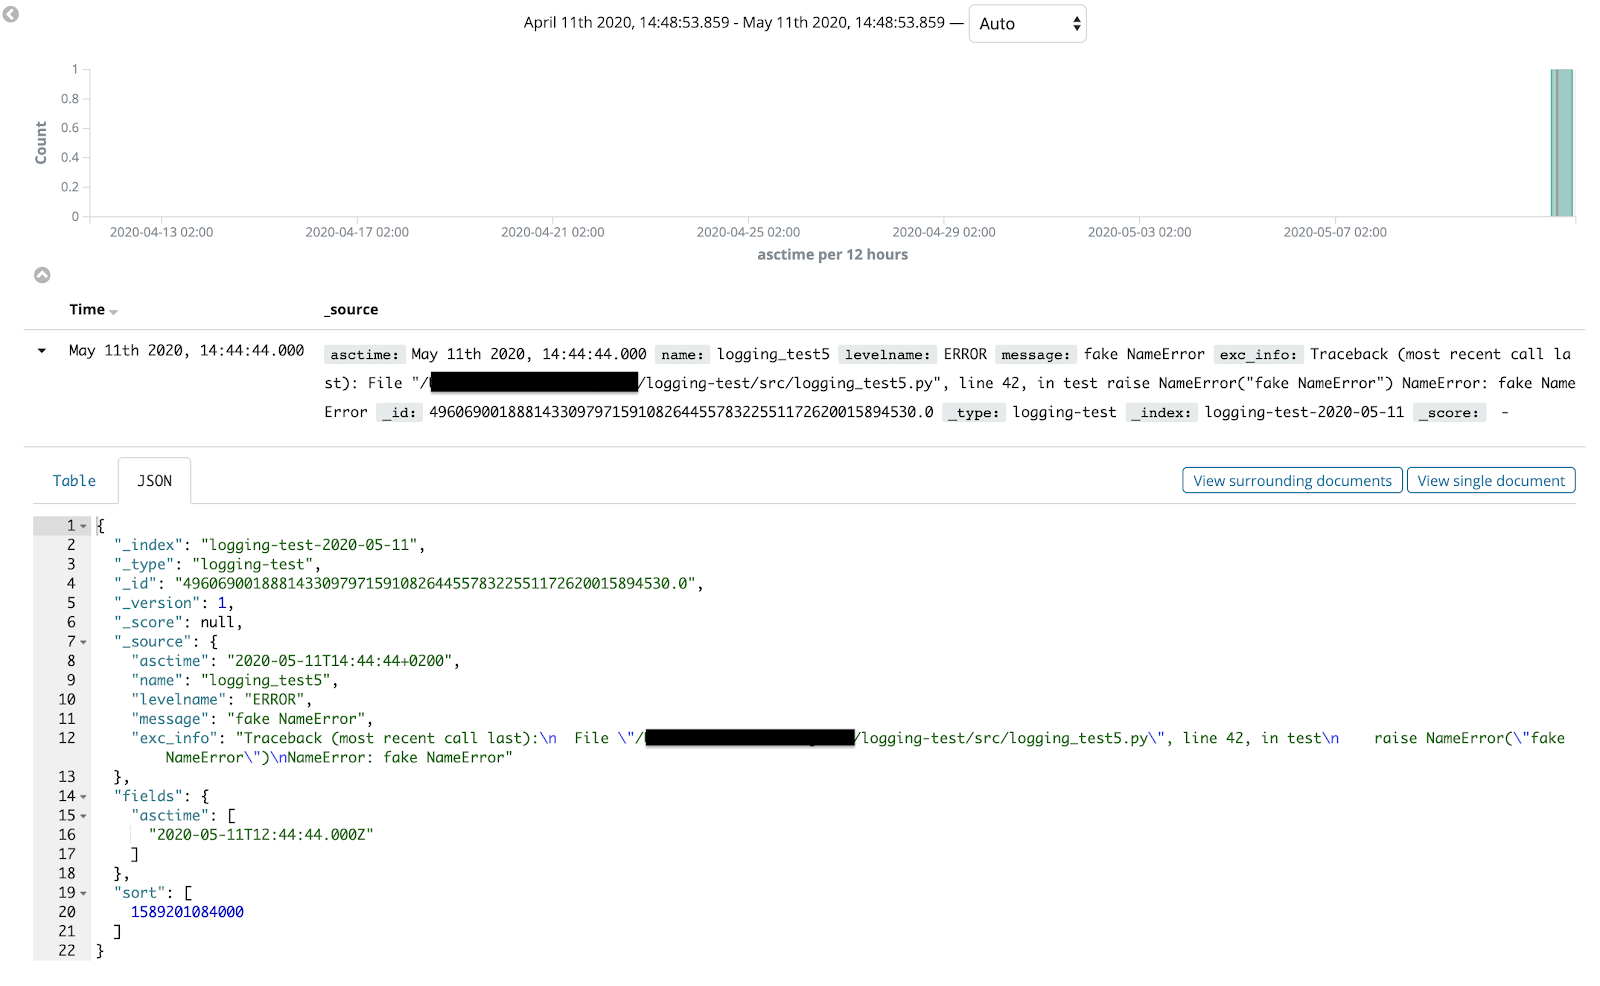 It is possible to further customize log records search and analysis experience to debug your application more efficiently, adding filters, and creating dashboards.With all being said, this concludes our coverage of Python’s logging module, best practices, and log aggregation techniques. We hope you’ve enjoyed reading through all of this information and maybe learned a few tricks.Until the next article, stay safe :)Read Part 1